AP Biology Strategy Q2 · Graphing · Strategy Playbook · Free
The Q2 Graphing Checklist
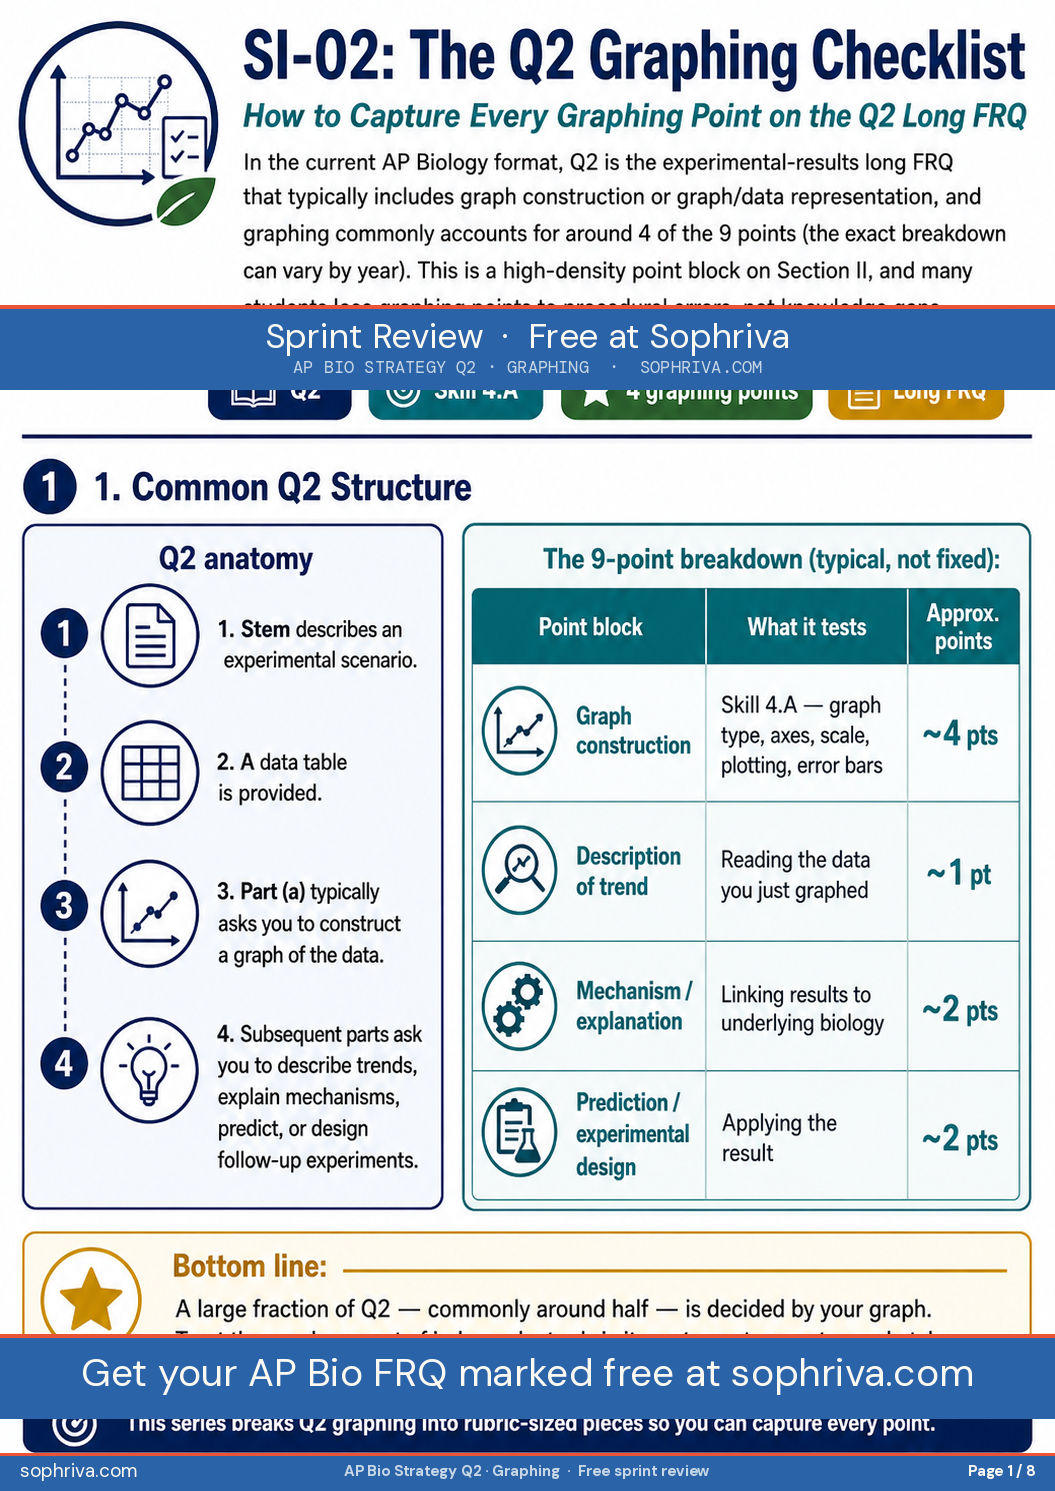
How to capture every graphing point on the Q2 long FRQ
Eight pages on capturing every graphing point on the Q2 long FRQ. Around 4 of the 9 Q2 points are typically graphing points — high-density, often lost to procedural errors not knowledge gaps.
Exam Weight
Q2 · ~4 pts
MCQs
n/a
FRQ Appearance
Q2 (every year)
Sprint Time
~30 min
Quick Glance — all topics in this unit
Priority, exam format, and the trap that most often costs the point. Transcribed from page 1 so this content is searchable.
| Topic | Priority | Format | Key trap / must-know |
|---|---|---|---|
| P1 Common Q2 Structure | ★★★ | Q2 | Q2 is the experimental-results long FRQ; ~4 of 9 points are graphing. |
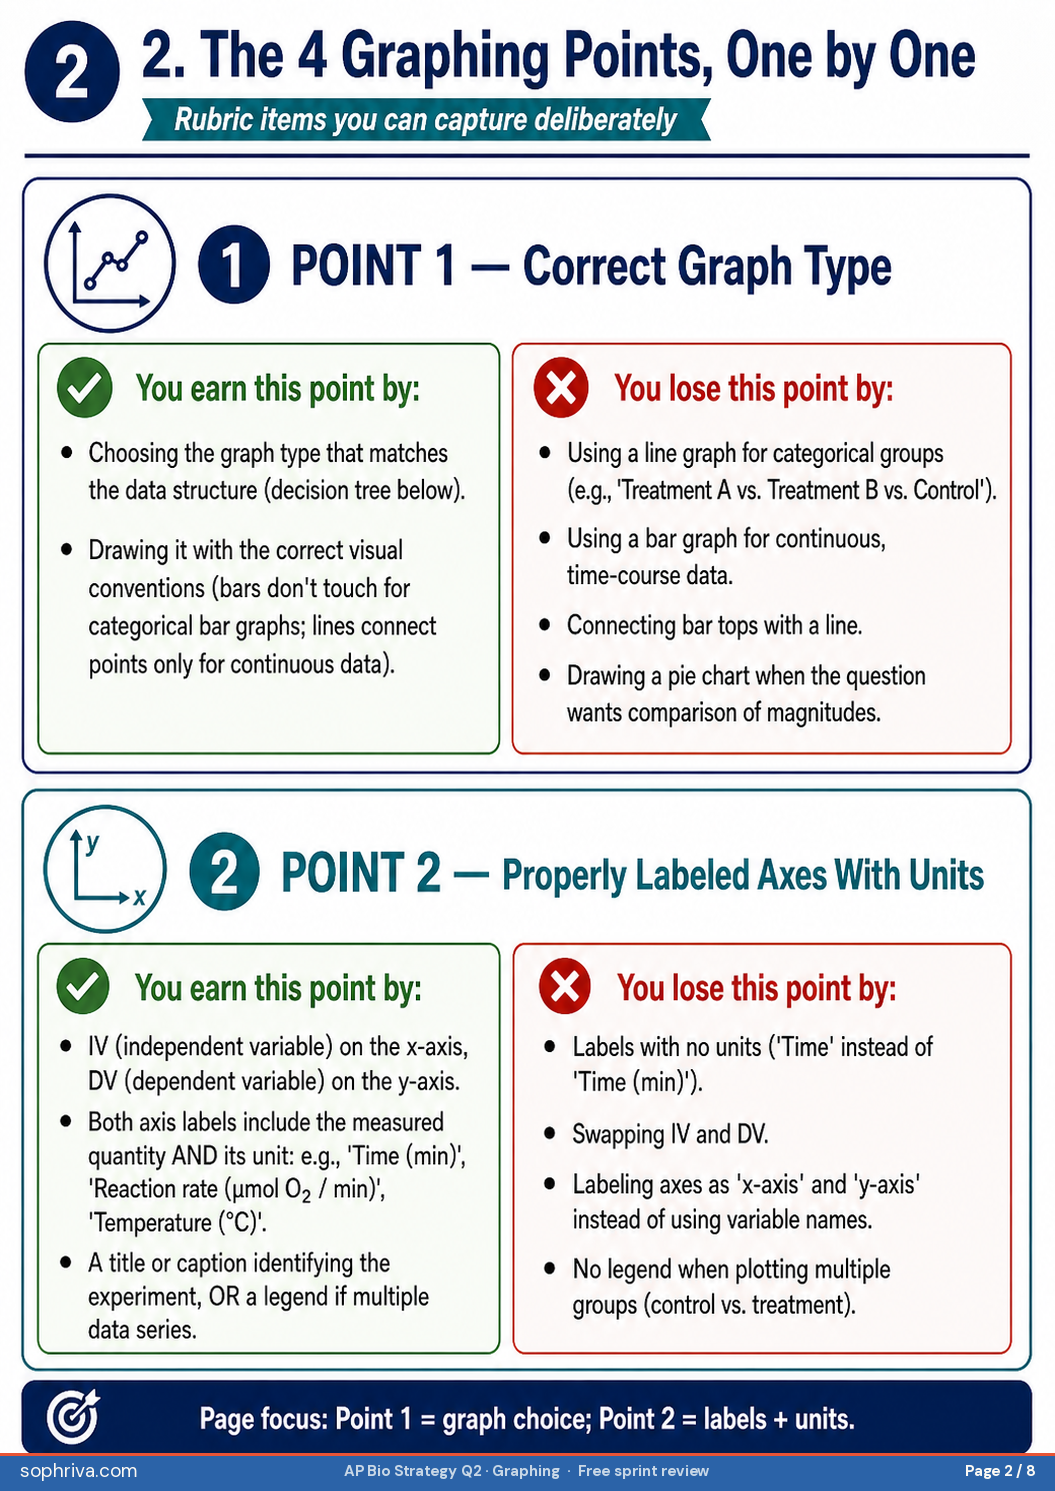
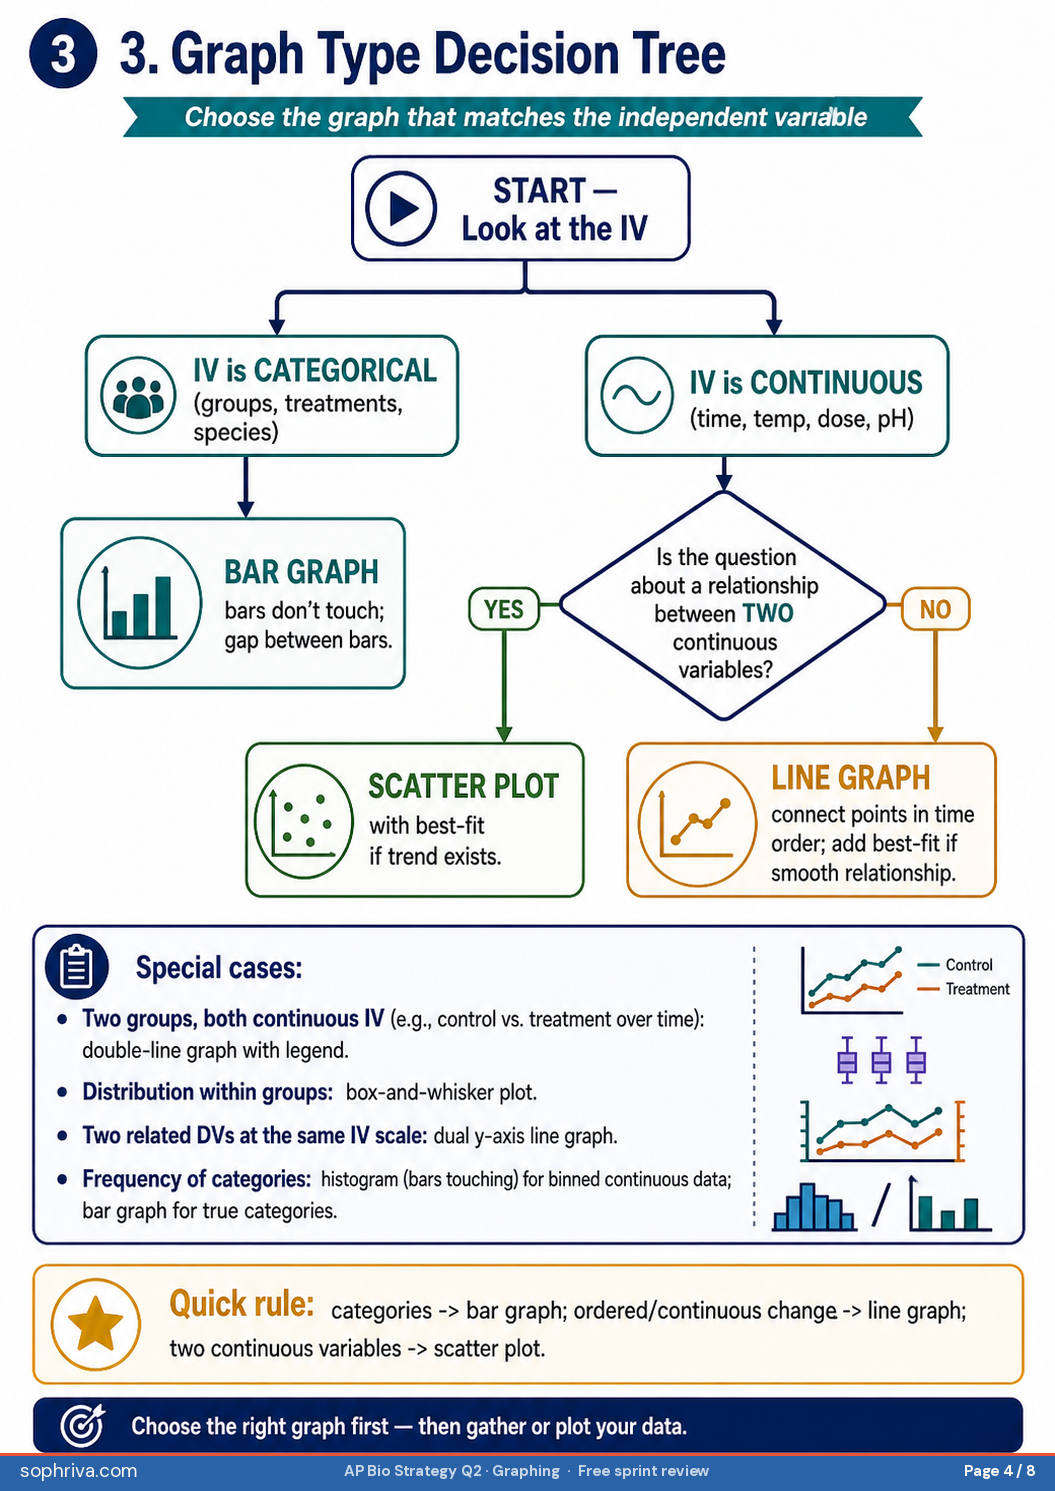
| P2 Graphing Point 1 — Type | ★★★ | Q2 | Bar for categorical, line for continuous, scatter for relationship — get this right first. |
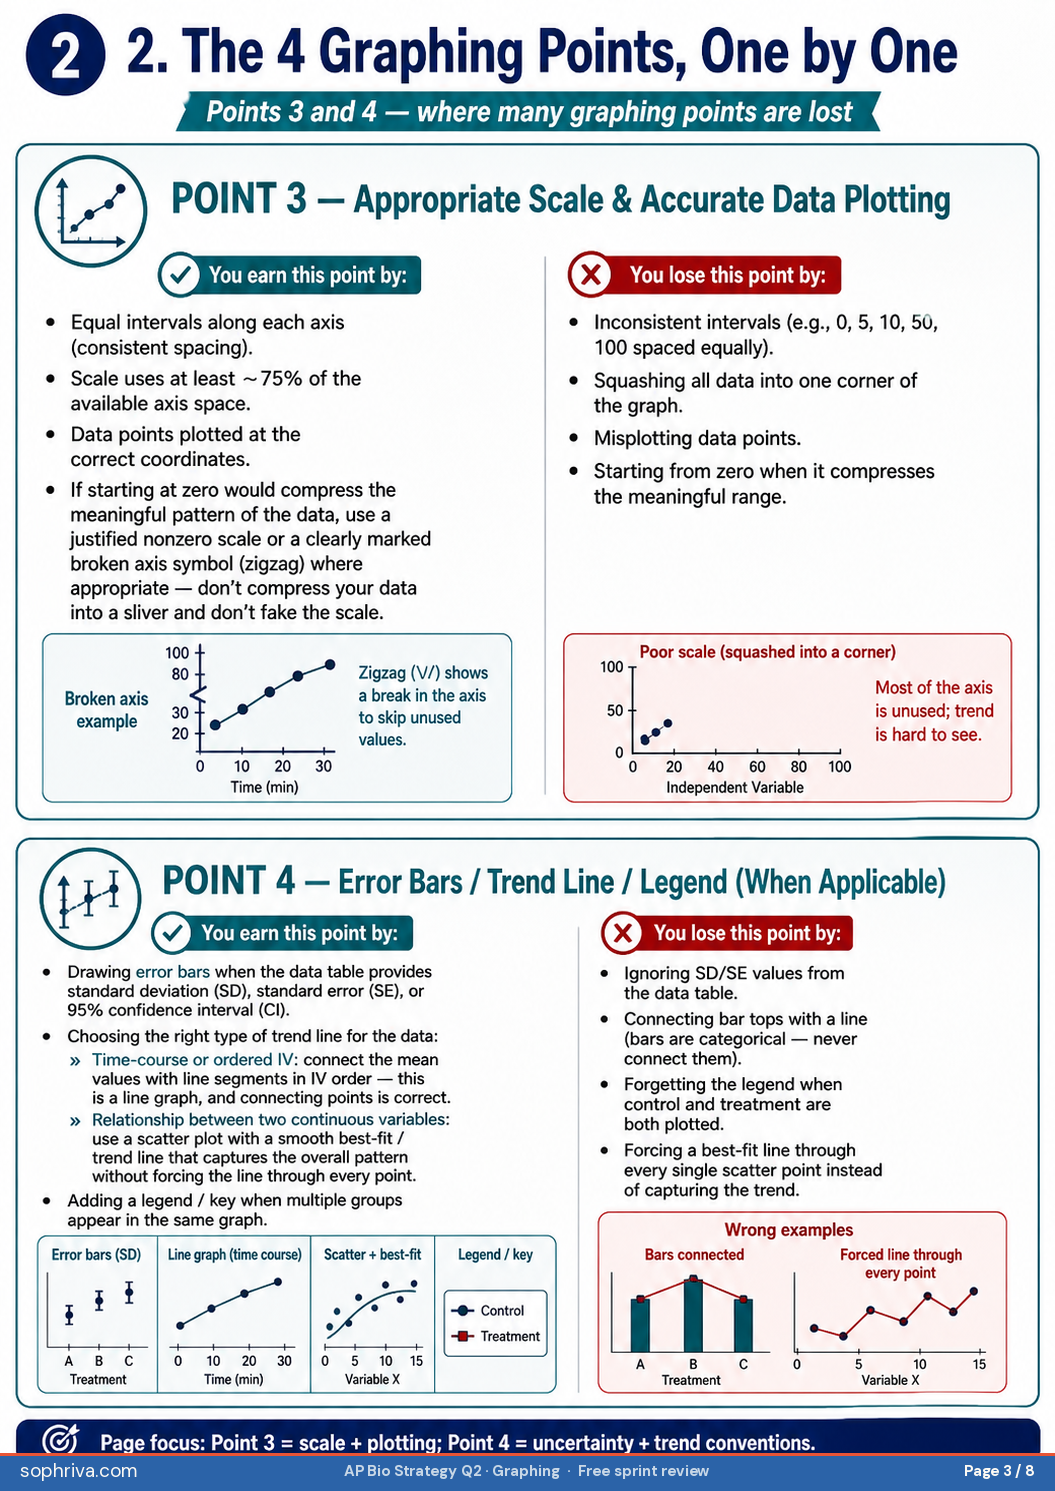
| P3 Points 2 & 3 — Axes & Scale | ★★★ | Q2 | Both axes labeled with units, scale starts at zero unless justified, intervals consistent. |
| P4 Point 4 + Decision Tree | ★★★ | Q2 | Error bars / trend line / legend when applicable; decision tree for graph type. |
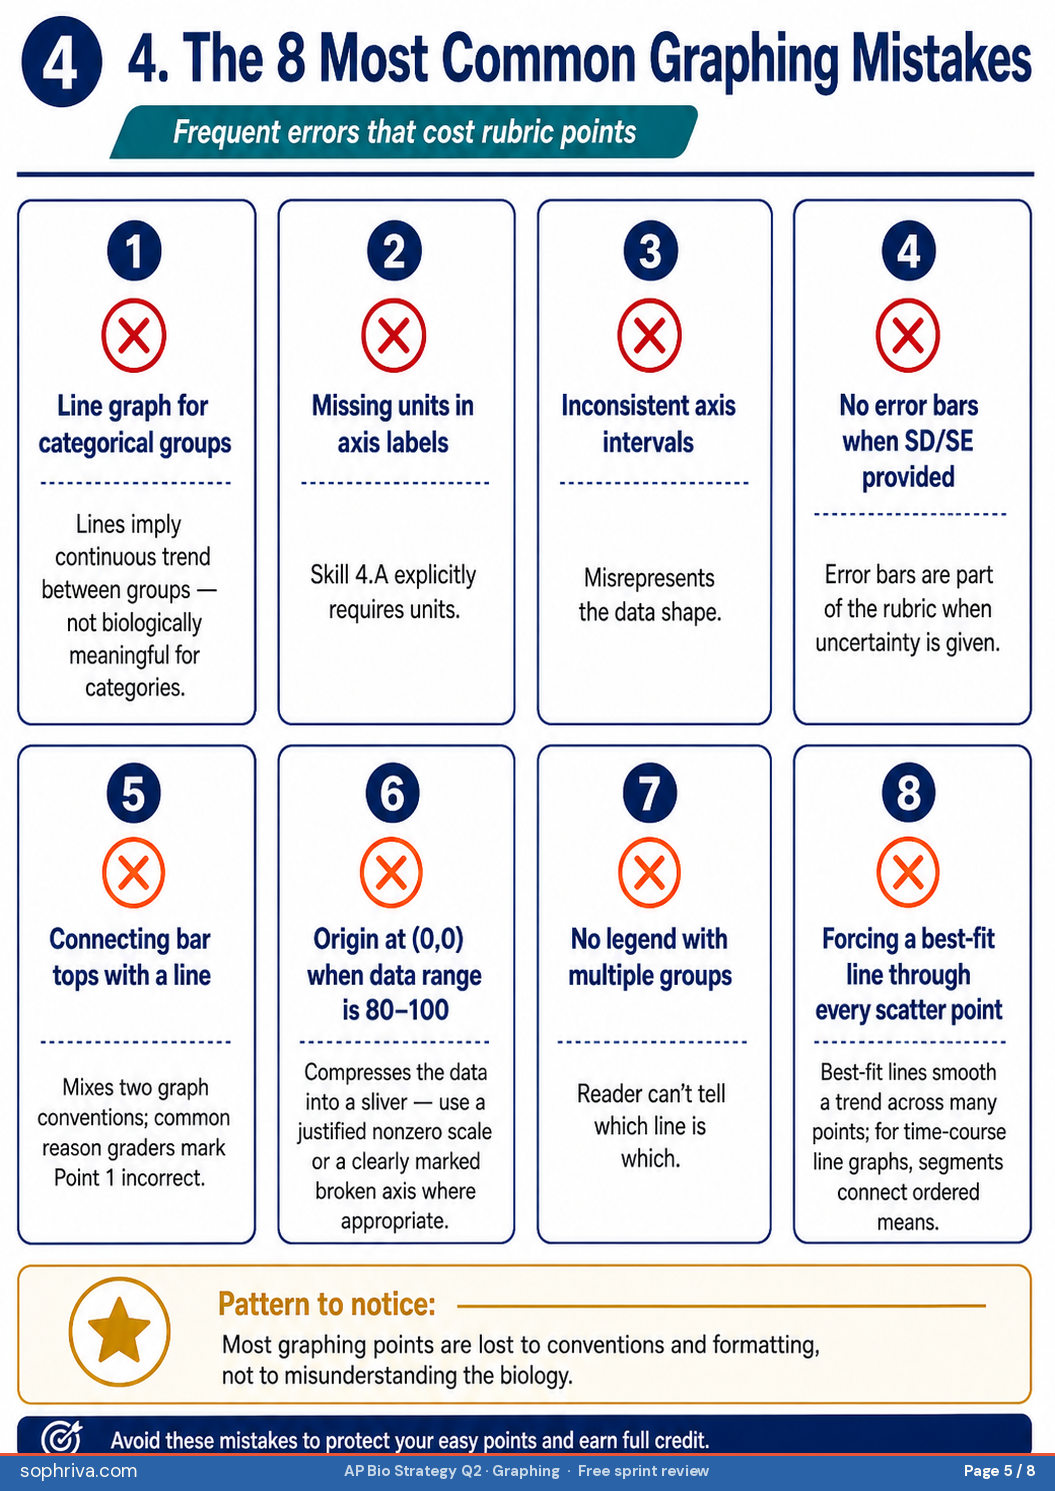
| P5 8 Common Graphing Mistakes | ★★★ | Q2 | Mismatched axes, missing units, unclear legend, no error bars when comparing means. |
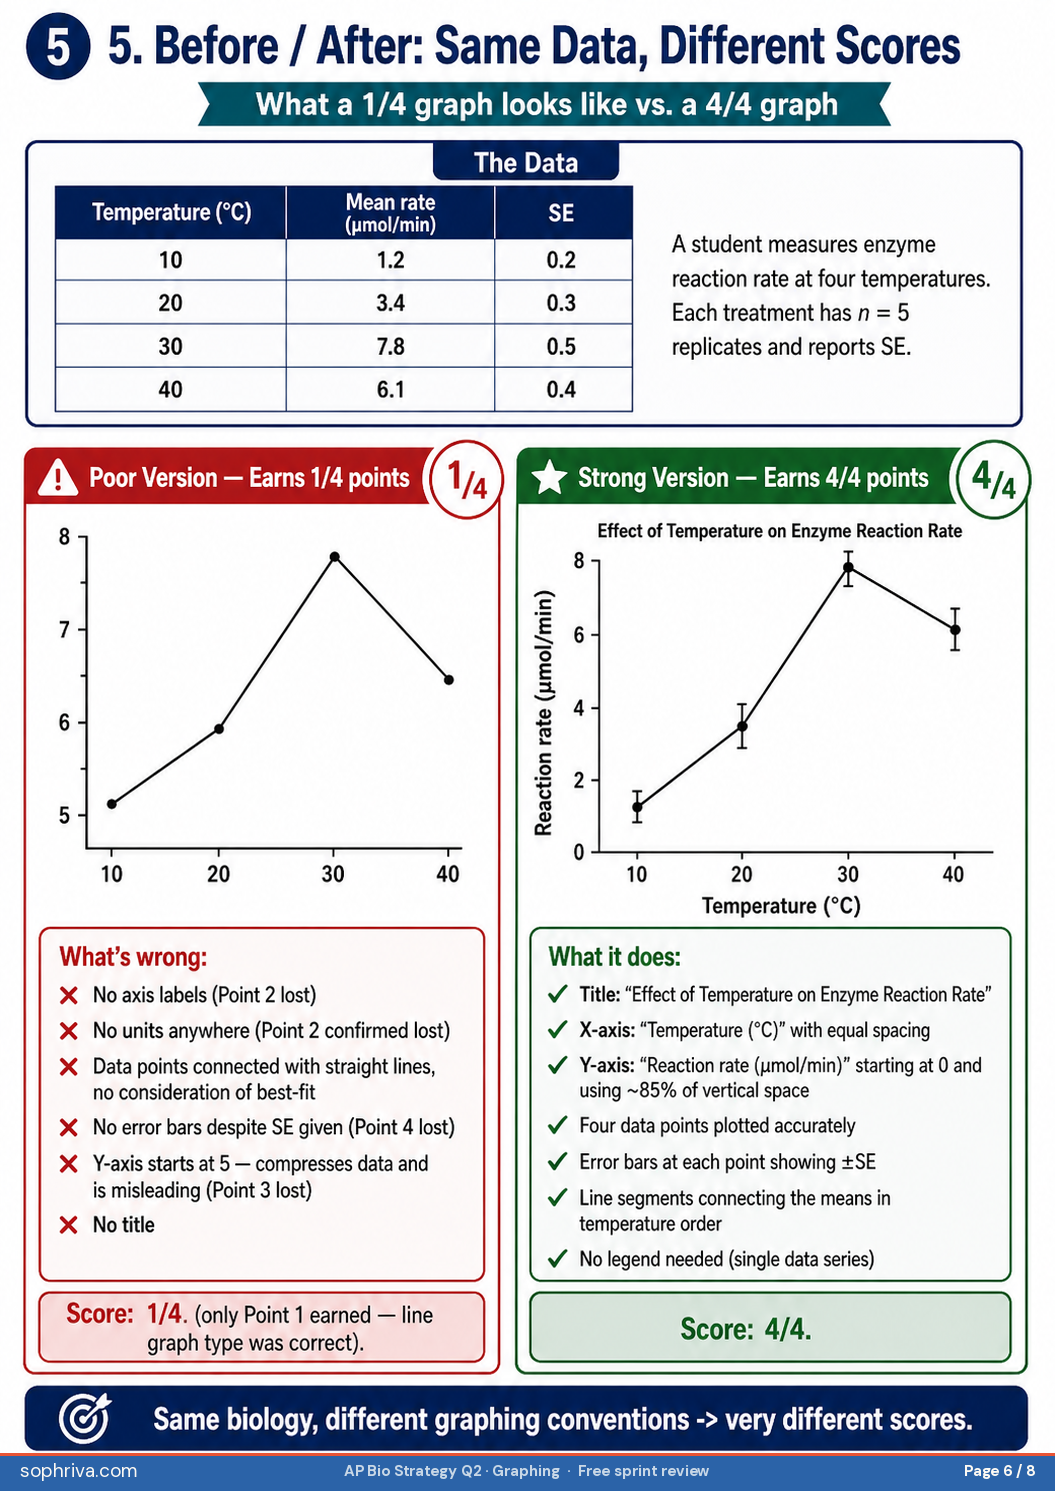
| P6 Before / After Same Data | ★★★ | Q2 | Same dataset, 1/4 vs 4/4 — what changed. |
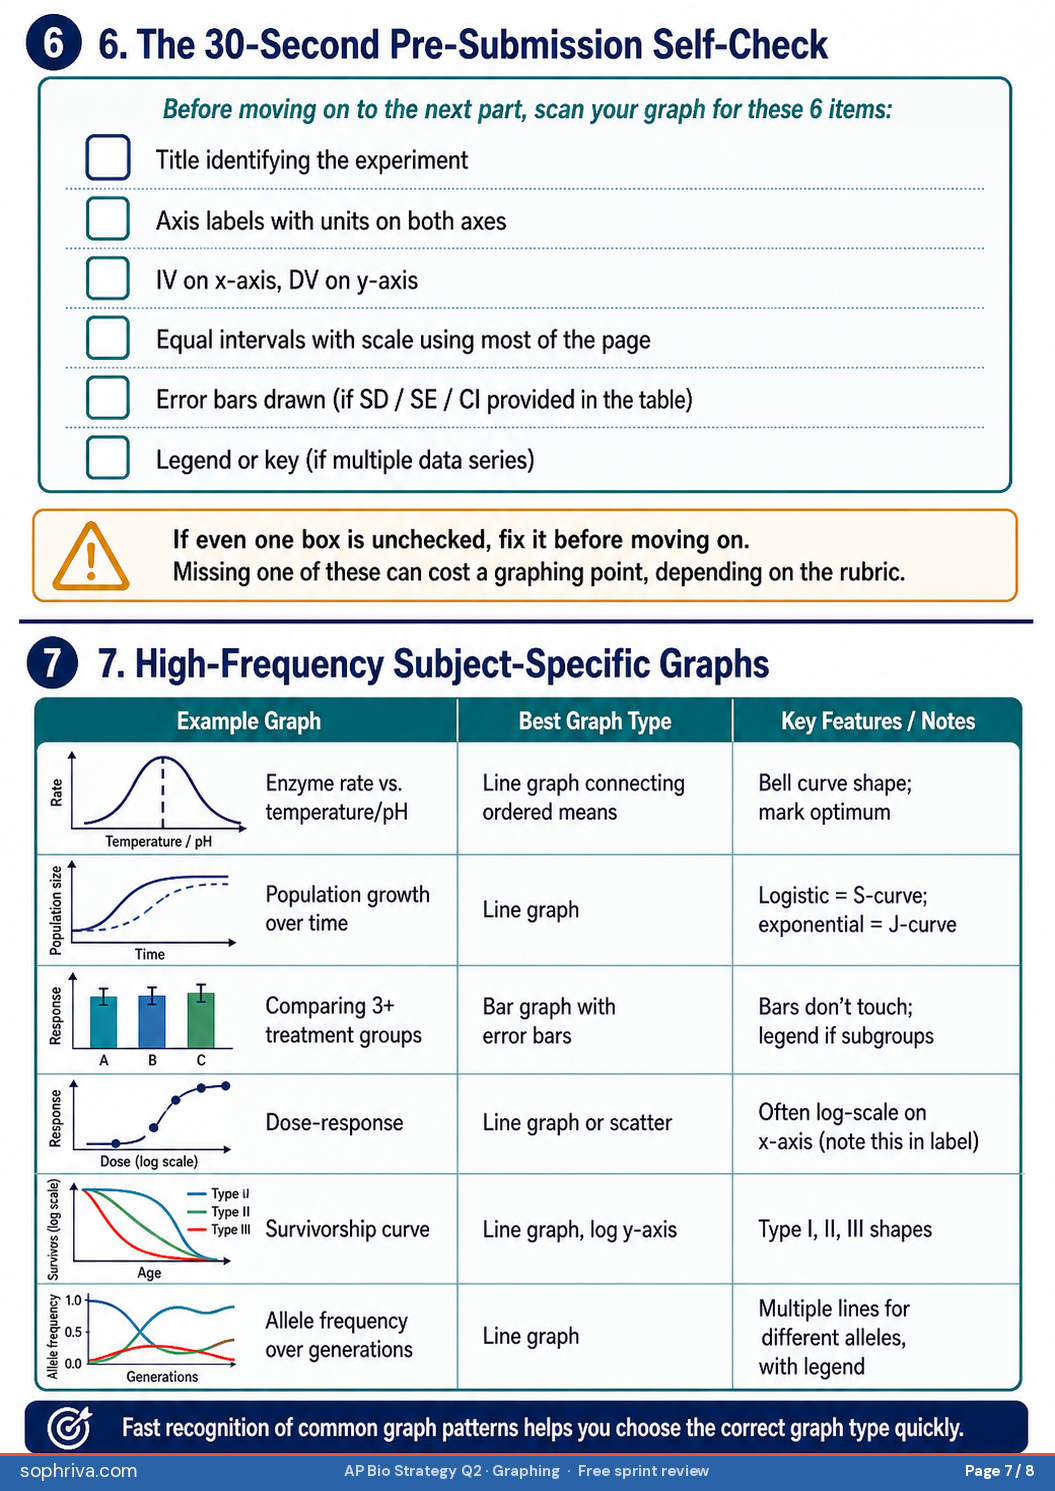
| P7 30-Second Self-Check | ★★ | Q2 | Last-minute checklist before turning the page. |
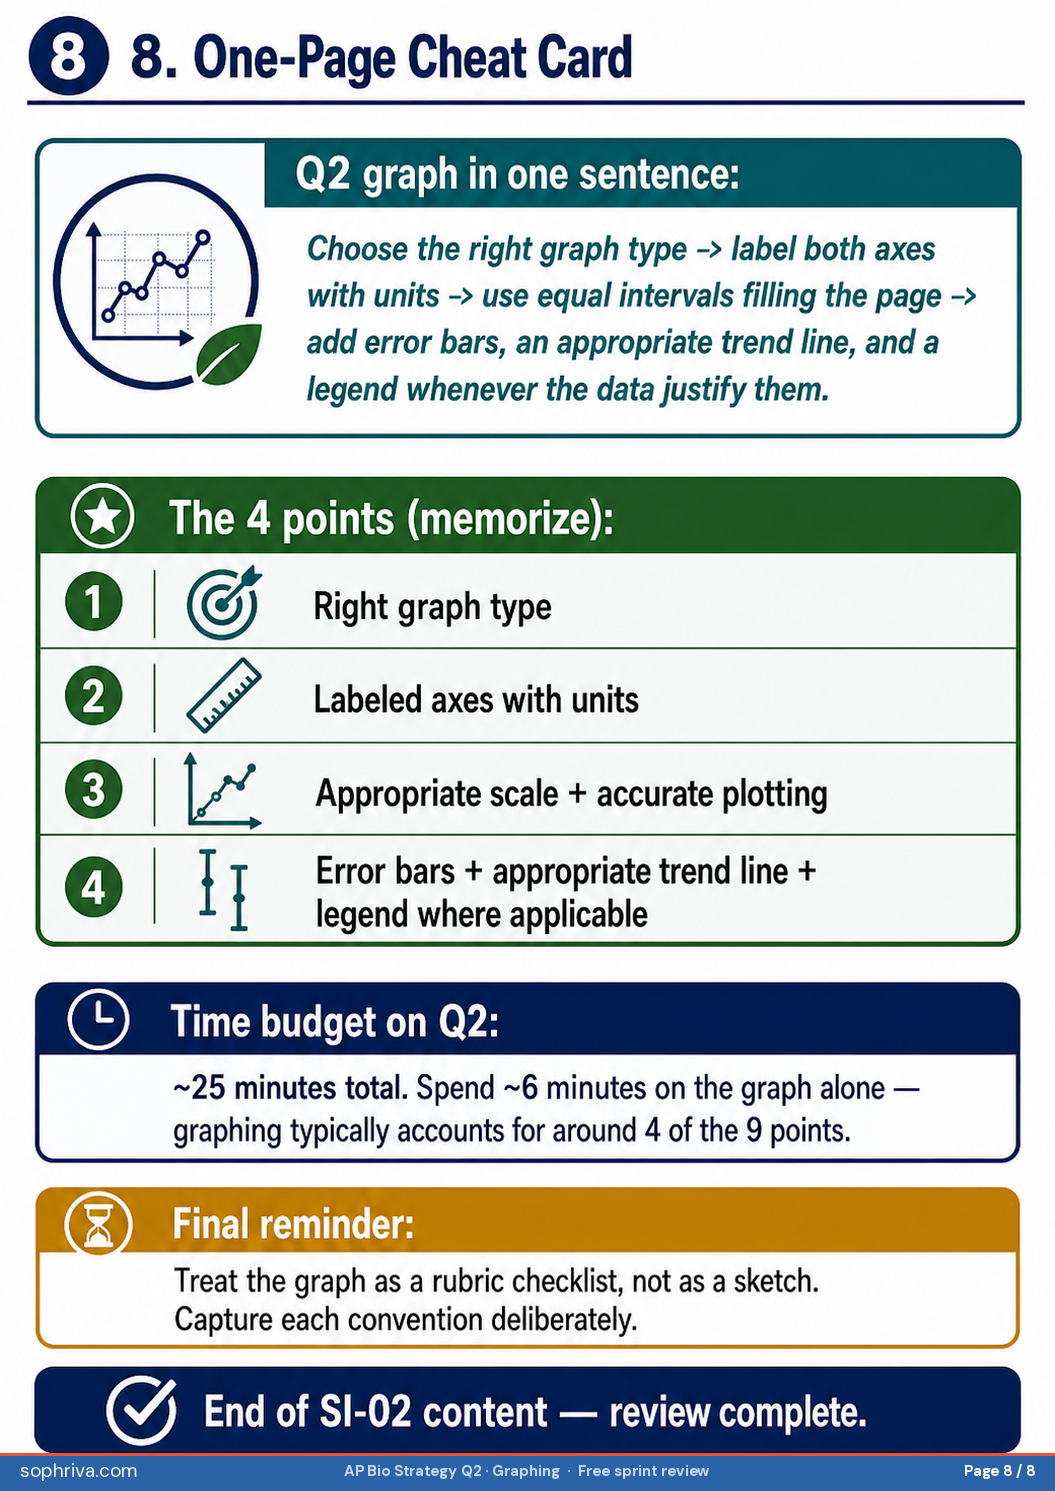
| P8 Cheat Card + Subject Graphs | ★★ | Q2 | Topic-specific common Q2 graphs (enzyme kinetics, population growth, etc). |
Topic-by-topic visual review
Nine pages, one topic each. Open the PDF for print quality, or scroll to study on screen.
Done with the sheet? Now get marked.
Upload your own AP Bio FRQ and we score it like an AP Reader — point by point — and show you exactly which rubric points you missed.
Get your first FRQ marked free →